
This series asked our readers: “What do you wonder about Kansas City, the region, how it’s shaped, or its people?" Your questions helped us foster a cycle of inquiry and delivery of information that can help us to make a difference where it matters most.
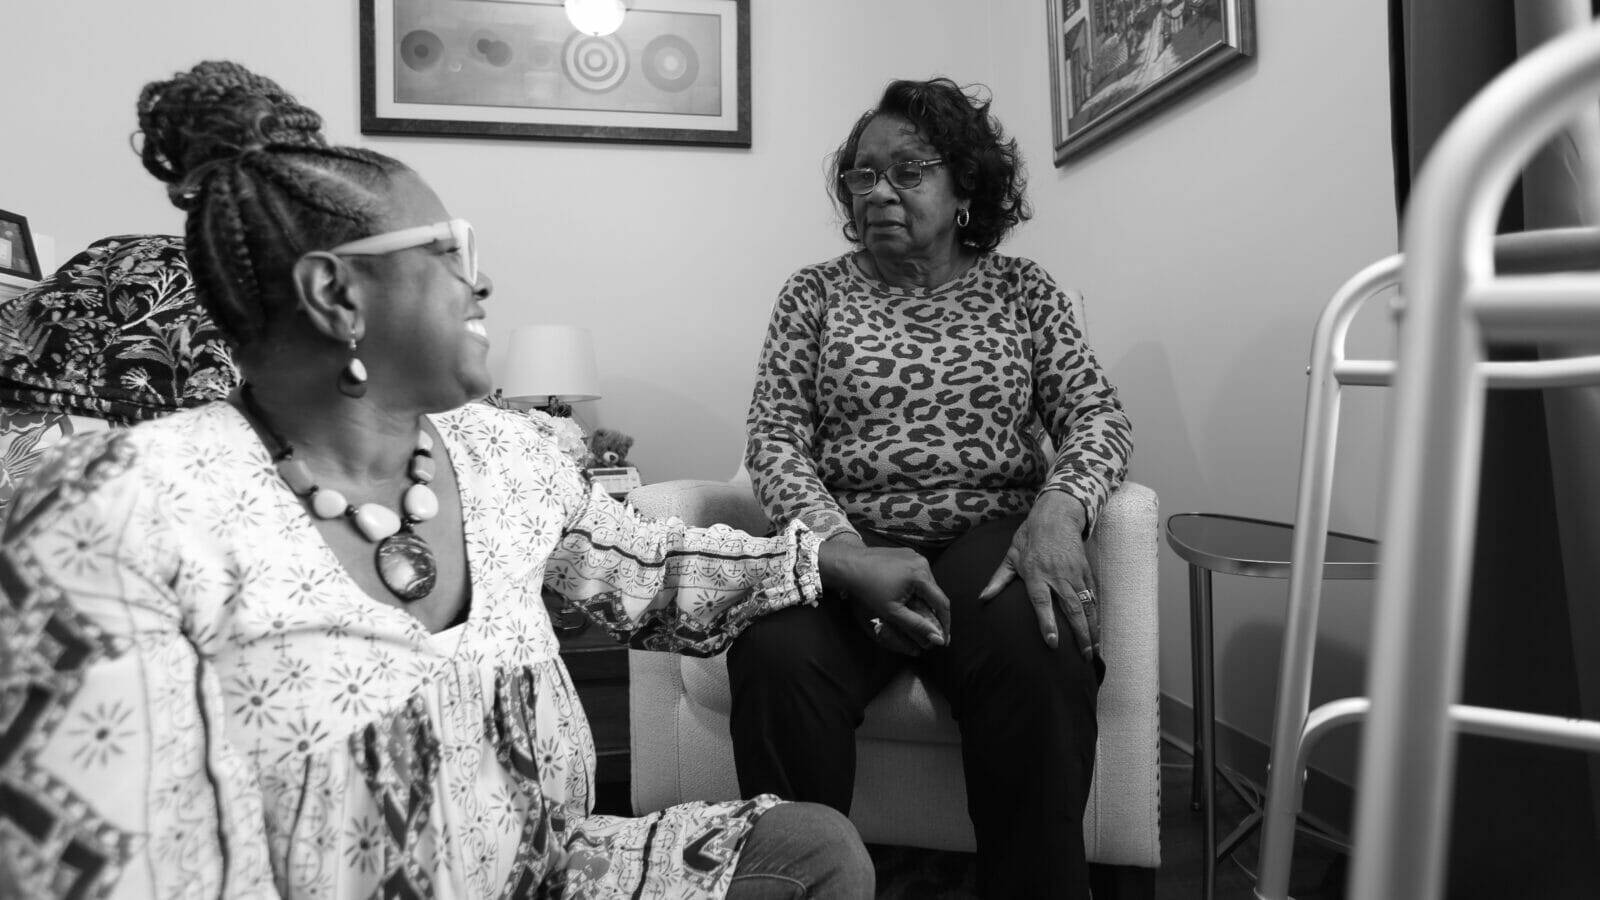
curiousKC | Aging and Long-Term Care in Kansas City
In September, Kansas City PBS and Flatland will explore the challenges facing families and their aging members. “Age-Old Questions” reporting will provide a comprehensive look into many of the questions and concerns related to retirement, finances, caregiving, and the at-home…
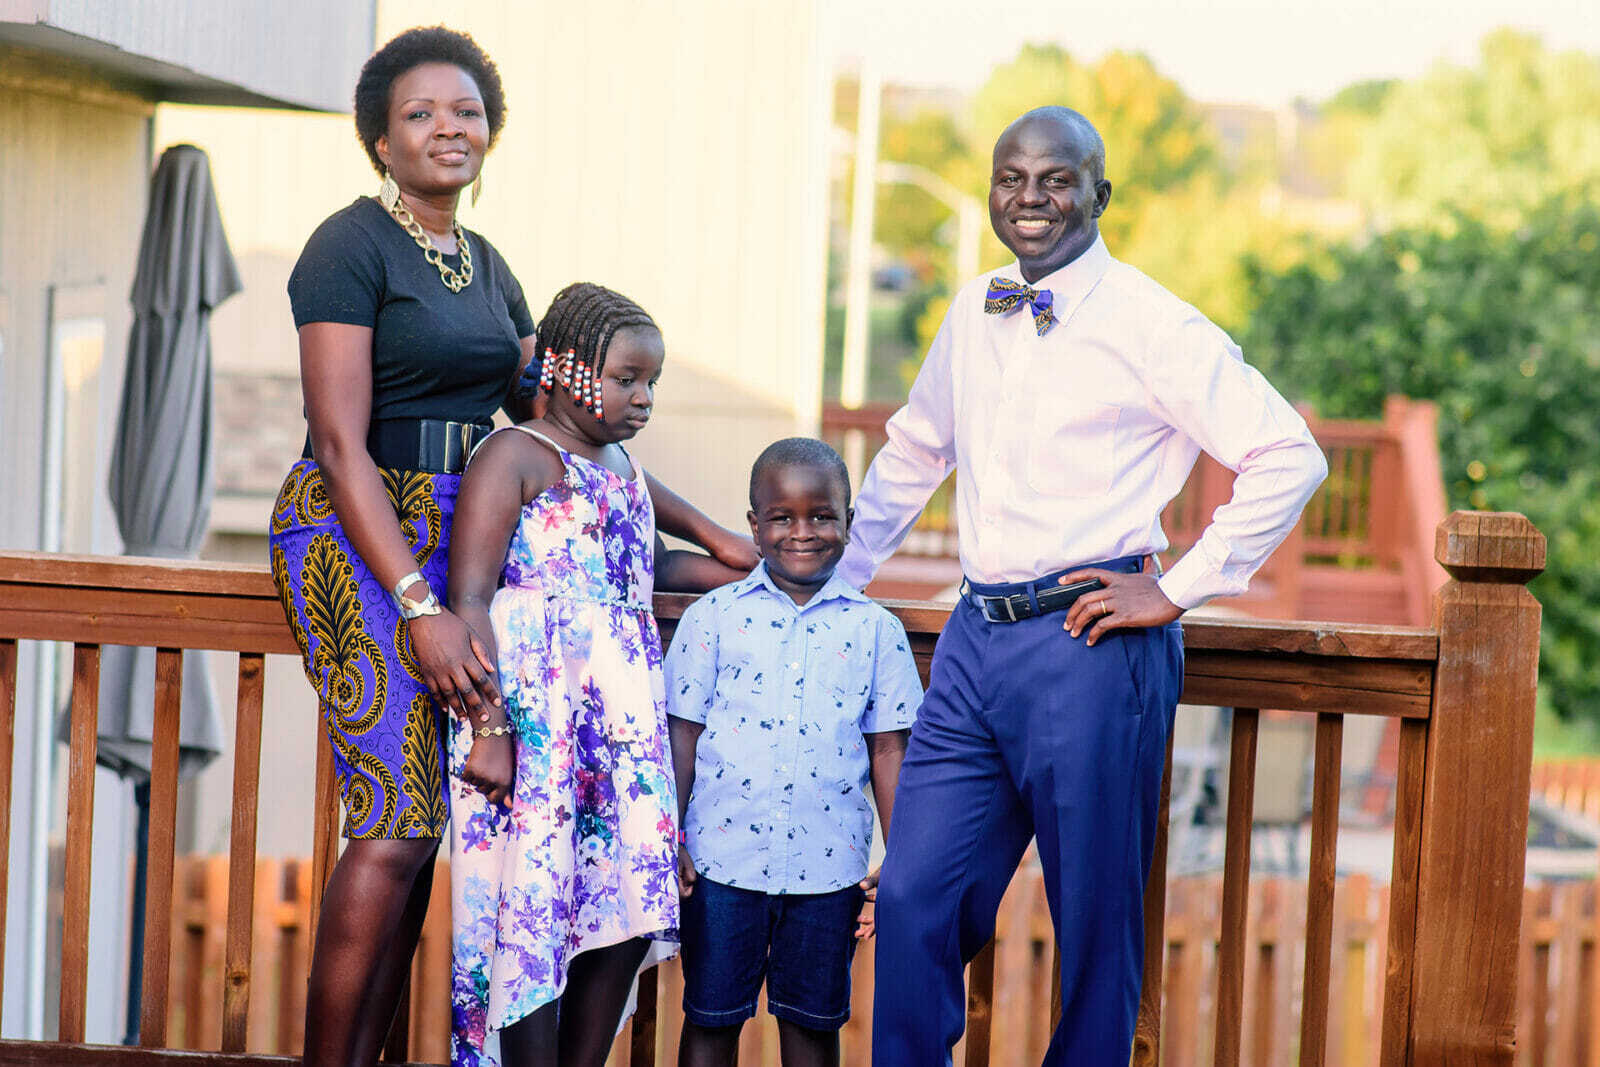
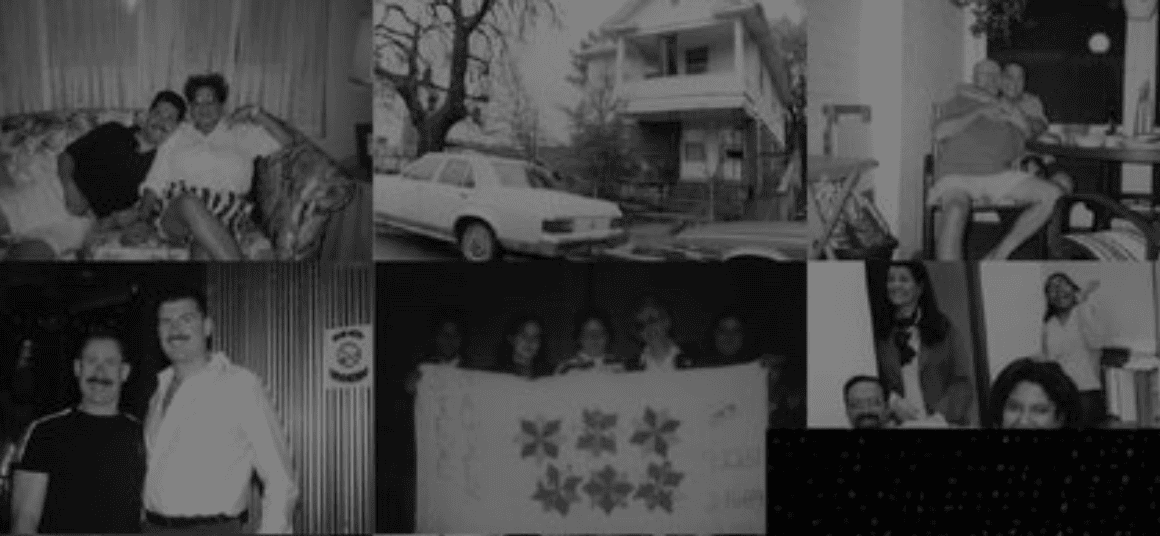
curiousKC | How Refugee Resettlement Works for Those With Careers
How do refugees who had existing lives and careers rebuild in Kansas City? The answer in this curiousKC story.
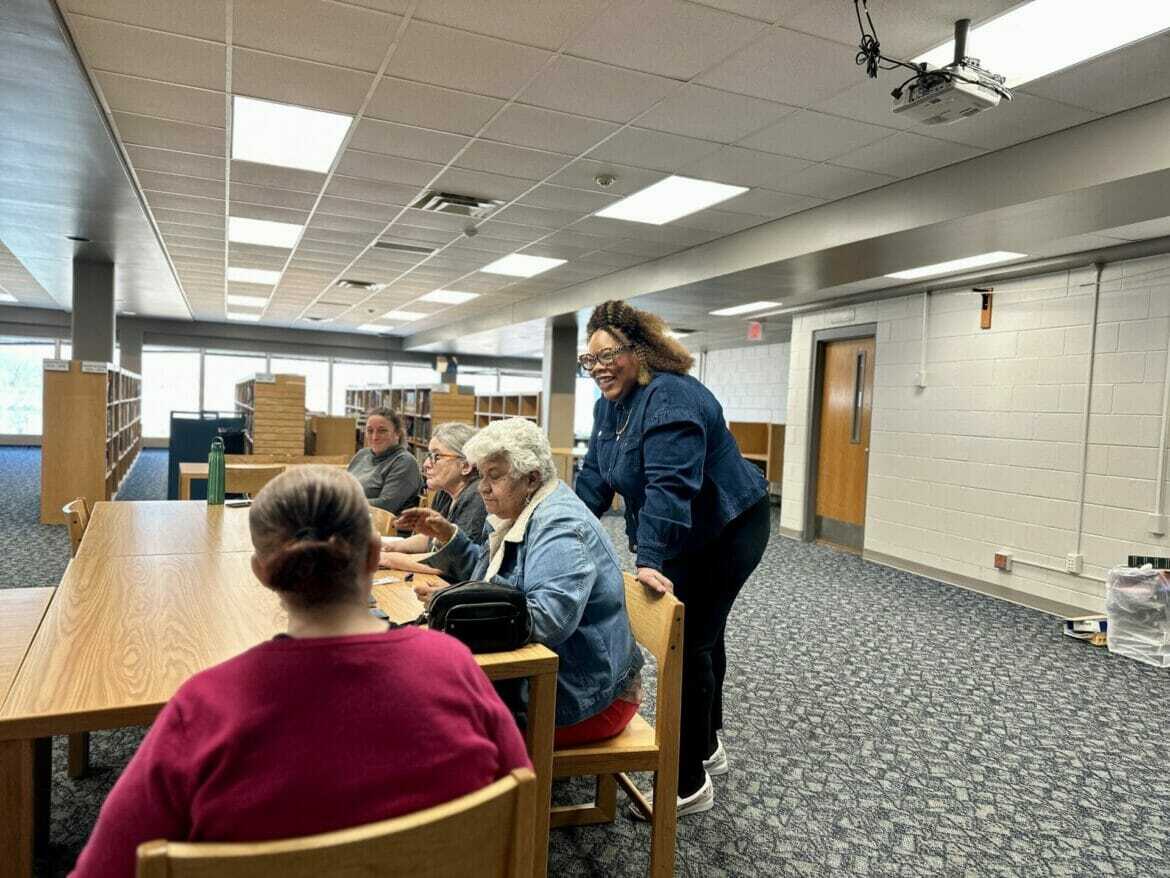
curiousKC | A Resource Guide for Youth with Developmental Disabilities
Here’s a guide to transition supports and programs for youth with disabilities in the Kansas City area confronting the “high school cliff.”
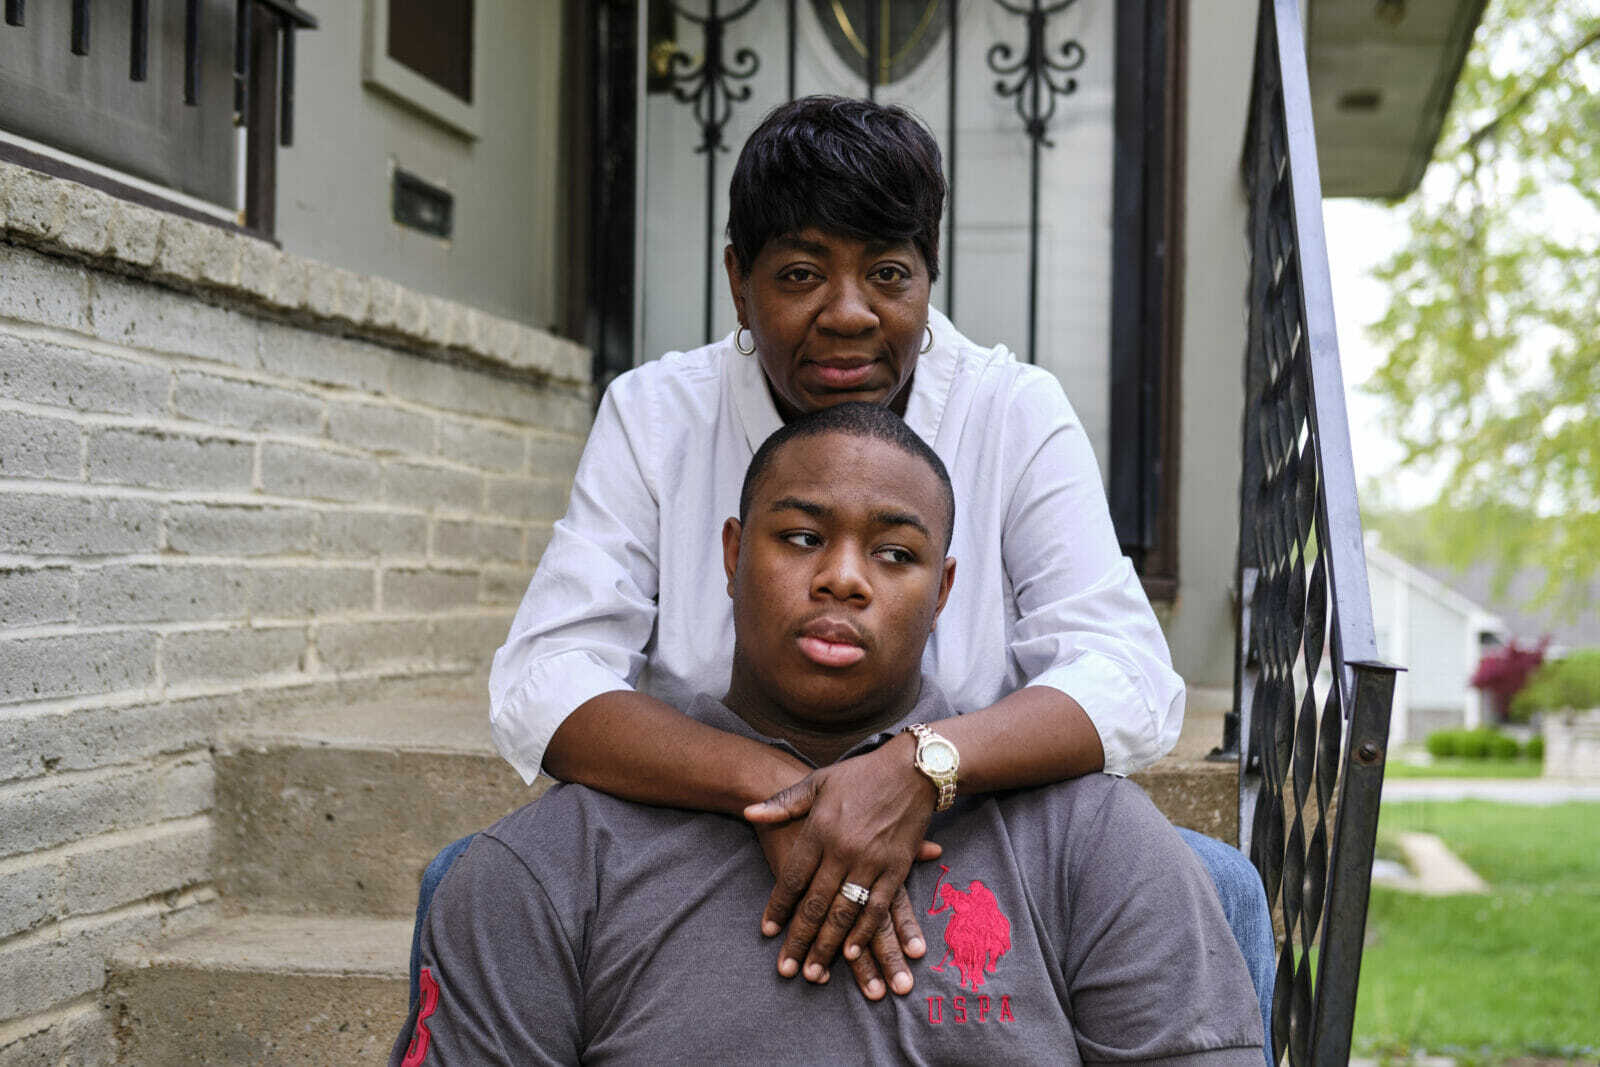
Confronting the ‘High School Cliff’: What Young Adults with Disabilities Need to Succeed
Four years ago, a Kansas City mom created a program for young adults with disabilities like her son. Today, that program has become a resource for people facing the “high school cliff.”
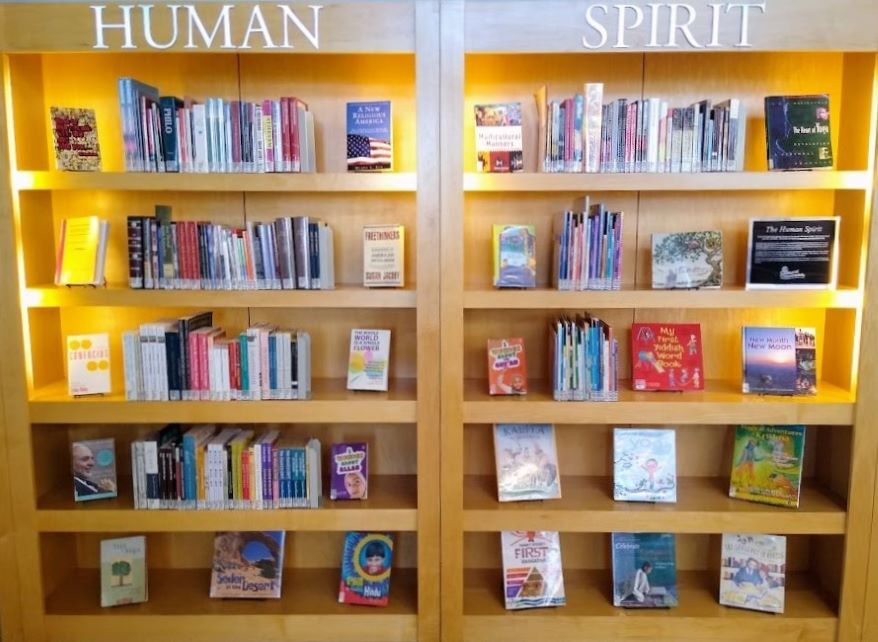
‘Canceled, Censored, Banned’ Sparks Questions About Government, Books and Public Libraries
Missouri Secretary of State Jay Ashcroft’s proposed rule addressing material at public libraries has sparked questions about book restrictions. Here are answers.
curiousKC | Submit Questions About Disability Resources in KC
“Will my child with disabilities find a job they enjoy?” Submit questions like this on access to disability resources to our curiousKC reporting team.
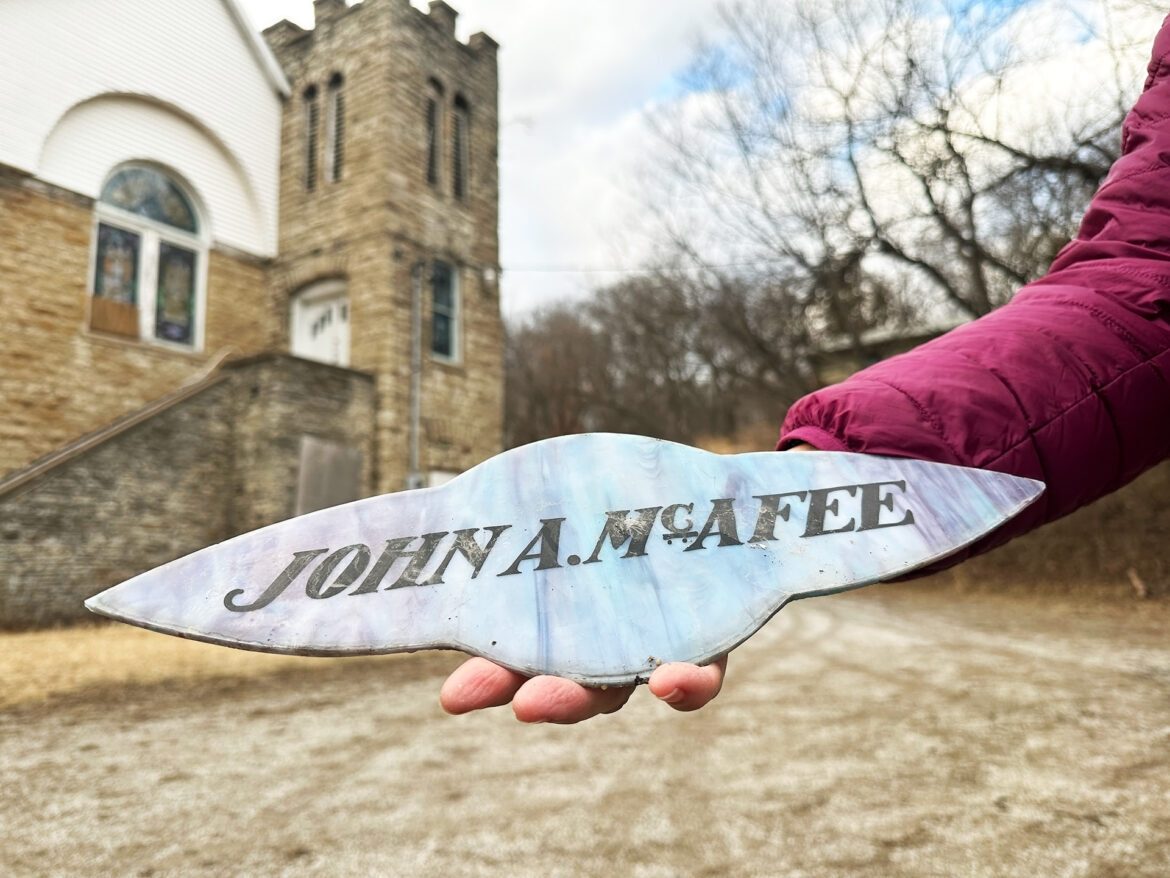
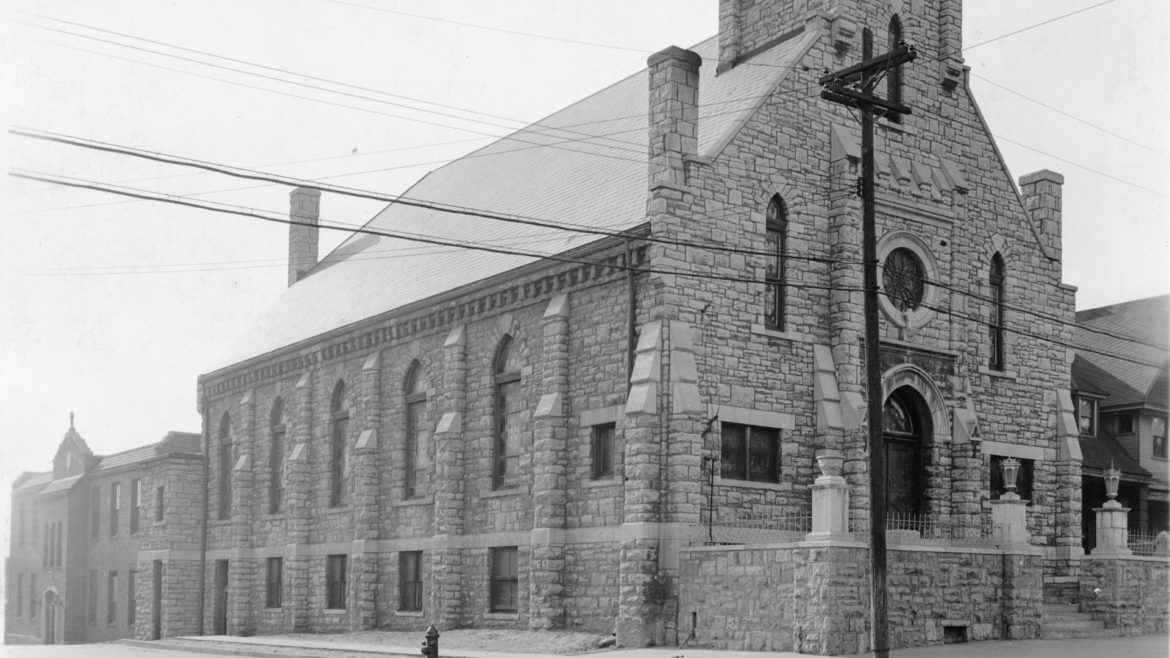
A 116-Year-Old Memorial Was Stolen, Then Returned, to a Historic Black Church
On Jan. 21, a 116-year-old memorial was taken from Parkville’s historic Black church. A week later, it was returned. This is how the community reacted.
curiousKC | What Questions Do You Have Since HIV/AIDS First Emerged 40 Years Ago?
This month, Flatland reporters focus on the implications the HIV epidemic has had on health equity. What questions should we cover?
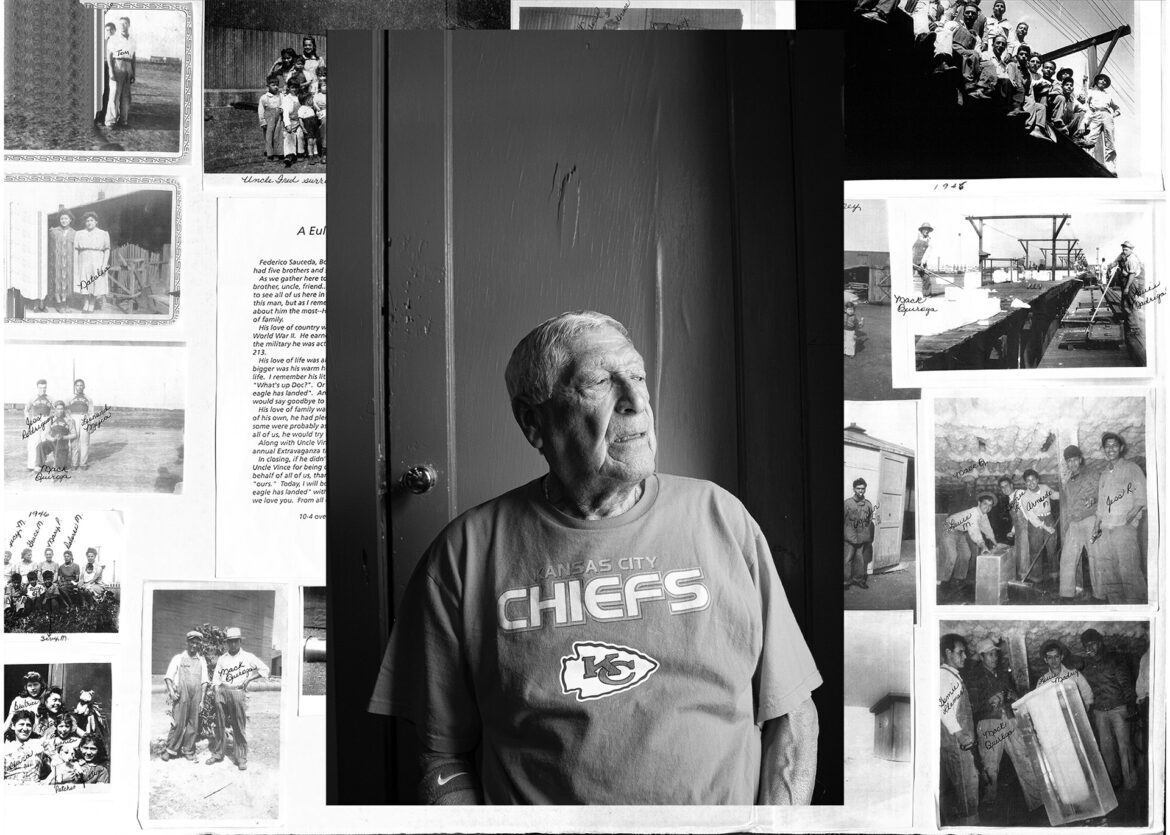
curiousKC | How Mexican Communities Kept KC Boxcars Cold
This is the story of “La Hielera” aka “The Ice Plant,” the tiny Mexican community nestled behind the 42nd Street Bridge and Santa Fe Railroad main line.
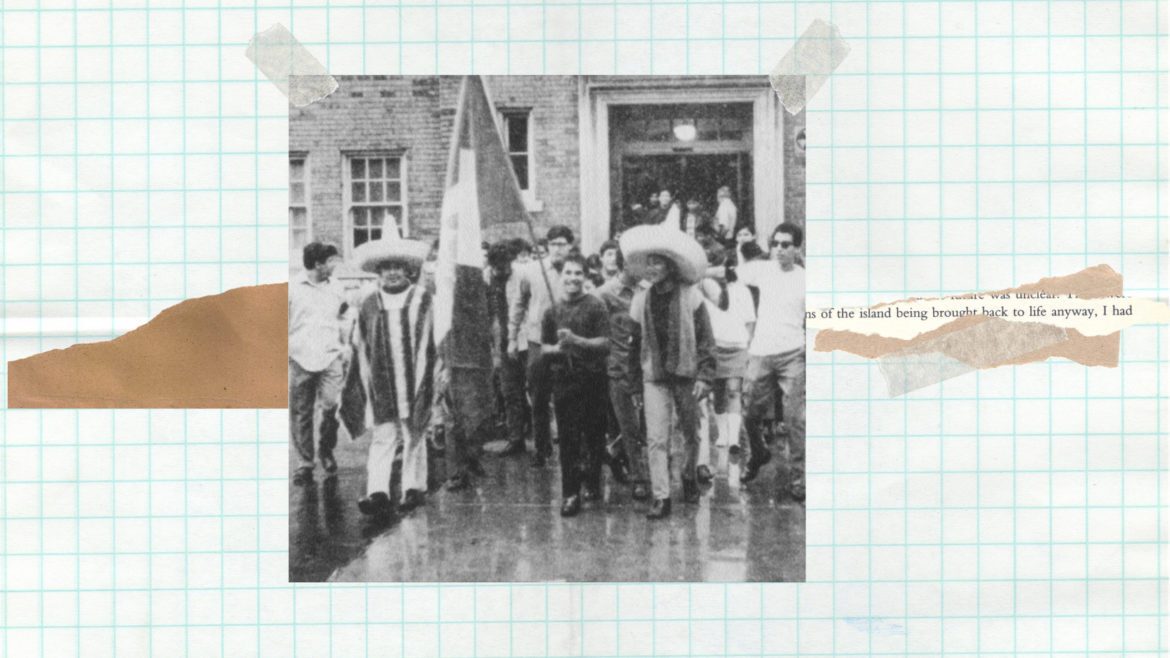
curiousKC | A Collection of KC’s Latinx Stories
Here’s a round-up of quintessential Kansas City stories to honor Hispanic Heritage Month.

curiousKC | Here’s How to Stay Healthy These Days, Say KC Health Leaders
Here’s what local health care experts and public health researchers want you to know about COVID-19 right now.

curiousKC | Call for Questions About How Youth Are Engaging in Politics
What piques your interest about young folks shaping the democratic landscape? curiousKC is now accepting your questions that could appear on the next episode of The Flatland Show.
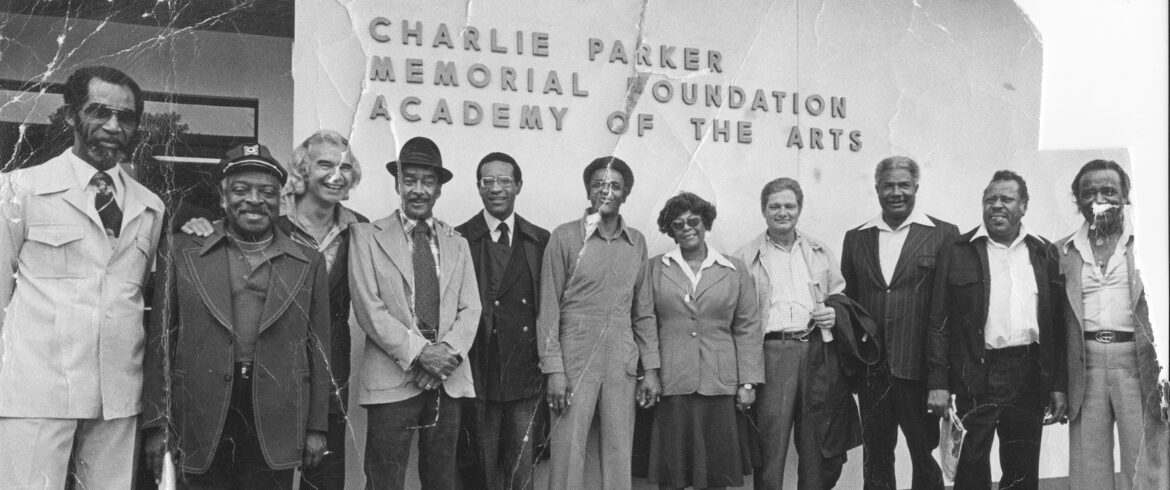
curiousKC | Where is the Charlie Parker Memorial Foundation’s Music School now?
The Charlie Parker Memorial Foundation school of music was lauded in the ’70s for getting kids “off the streets,” and “into the arts.” Local jazz artist asked: “What happened to it?”

curious KC | What Questions Do You Have About Ballot Initiatives in Missouri?
This month on Flatland, we’re examining ballot initiatives. We’ll talk to successful campaigns and failed campaigns to see what works, what doesn’t and why it’s important to many Missourians.
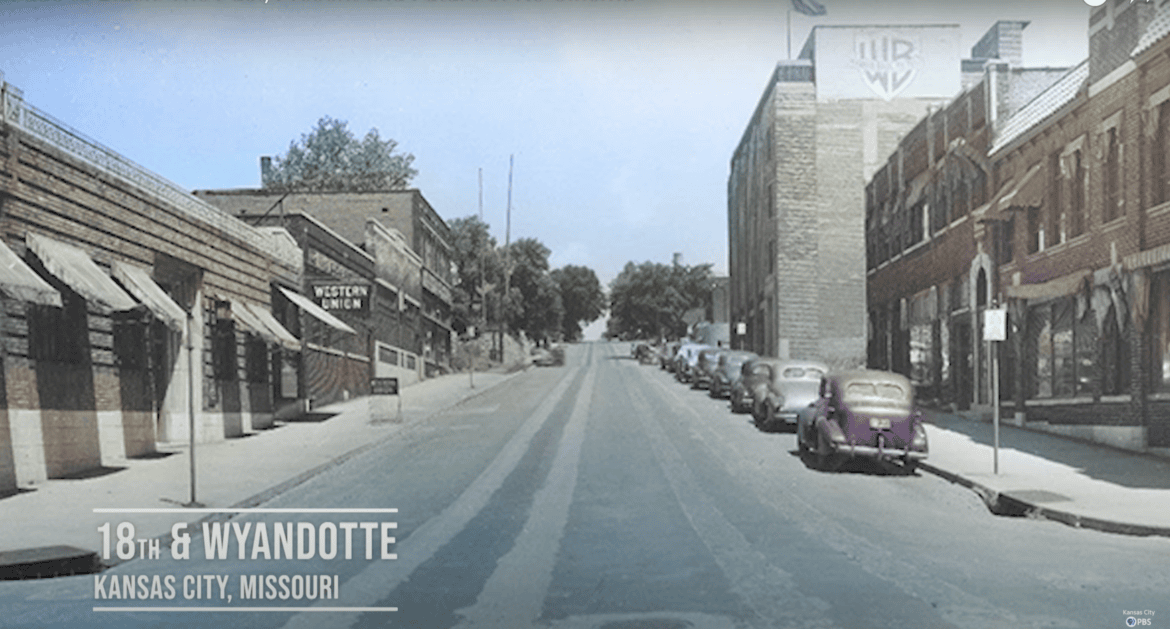
curiousKC: What Did Union Hill Look Like Before Redevelopment?
If ever you were curious, here’s your chance to learn what Union Hill looked like before it was redeveloped beginning in the 1980s.

curiousKC | Have a Question About Legalizing Marijuana? Let Us Know.
What questions do you have about legalizing recreational marijuana in Missouri? Flatland’s curiousKC team will find the answers.
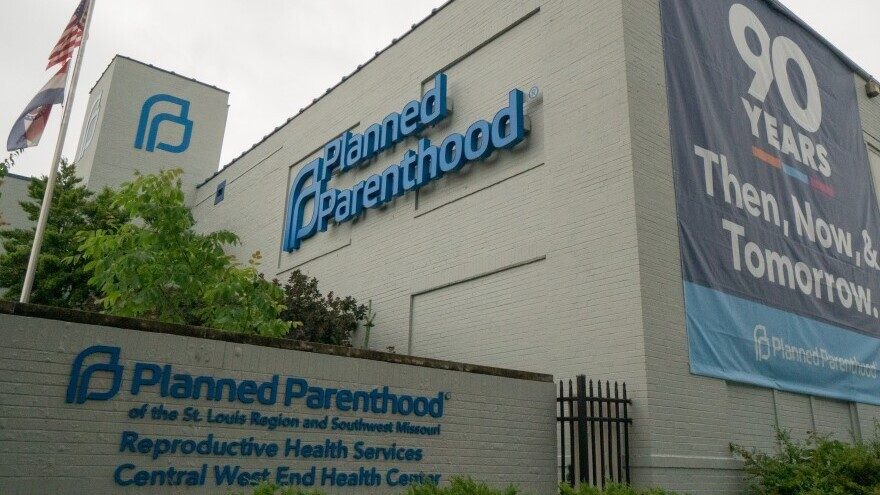
curiousKC | What are Reproductive Rights?
“Reproductive rights” has been a Google search phrase more in the past couple of months than in the search engine’s history. Here’s why, and what it means.

curiousKC | A Guide to What You’ll See in the Aug. 2 Kansas Primary About Abortion
On Aug. 2, Kansans will vote on a constitutional amendment that would uphold or remove abortion protections. Here’s what you need to know.
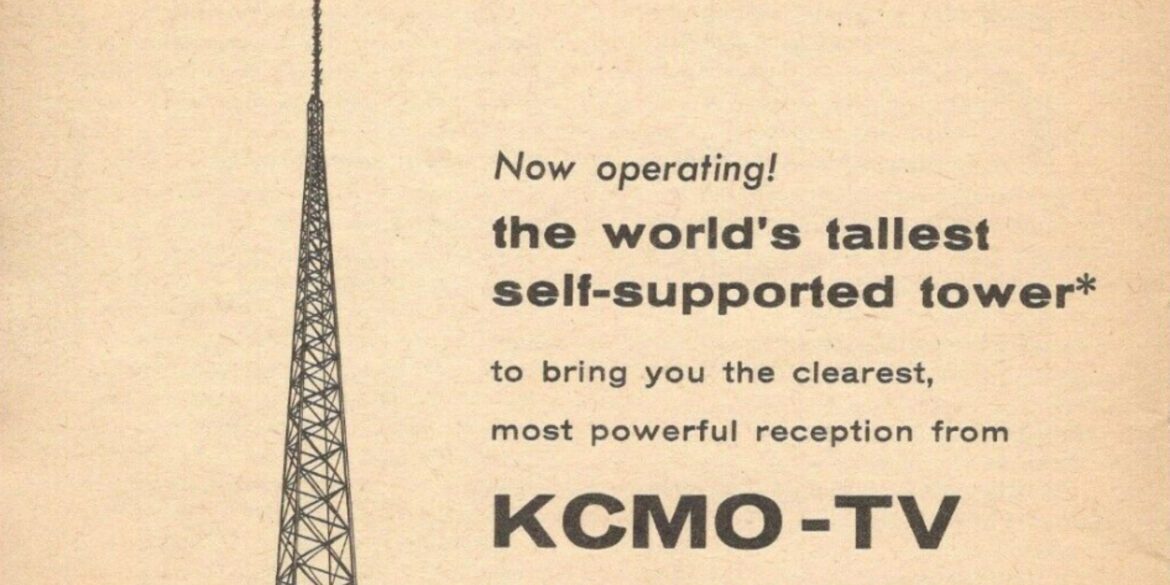
curiousKC | A Quick History Lesson on the TV Tower Near 31st and Main Street
Here’s your brief history lesson on the red steel tower at 31st Street and Main Street.

curiousKC | Send Your Questions on Reproductive Rights and Abortion
Flatland is turning to audience members for their questions to help shape its July 21 episode airing on Kansas City PBS.
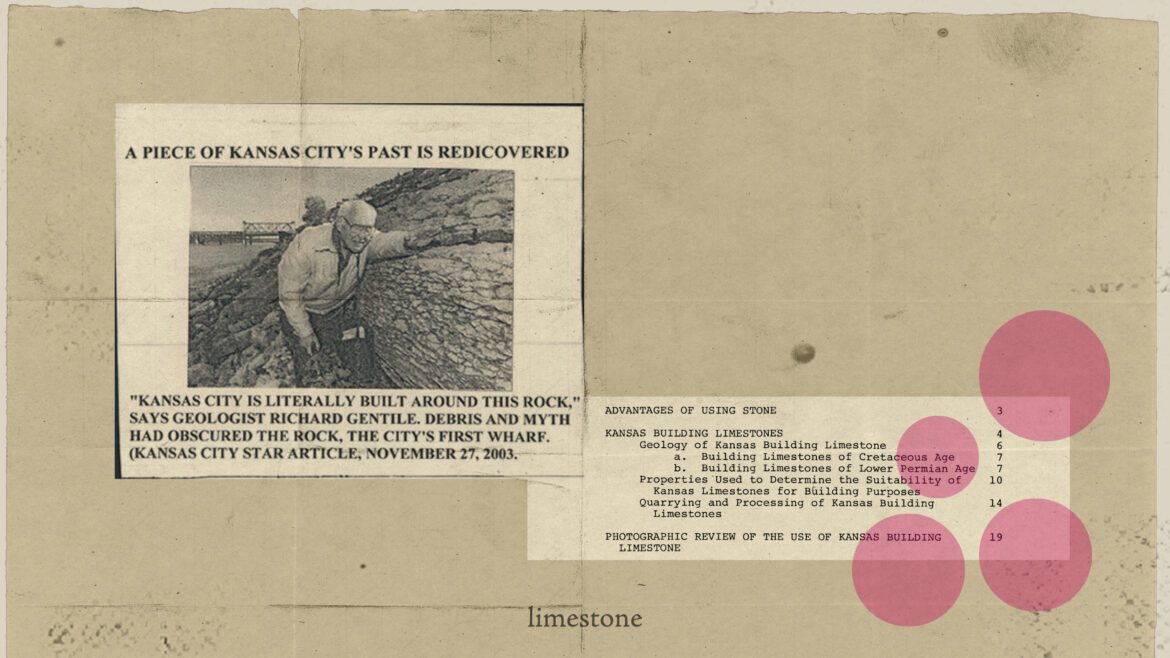
curiousKC | How Bethany Falls Limestone Helped Build Kansas City
Take a quick trek through history to learn why Bethany Falls limestone is so important in Kansas City’s development.
curiousKC | Kansas City’s Crossroads has a Historic Tie to Hollywood
Long before First Fridays became a thing, the modern-day Crossroads Arts District served as home to Kansas City’s own Film Row.

curiousKC | A Selection of Flatland’s Memorial Day Stories to Mark the Holiday
Here’s Flatland’s curiousKC round-up of Memorial Day stories you need to read.
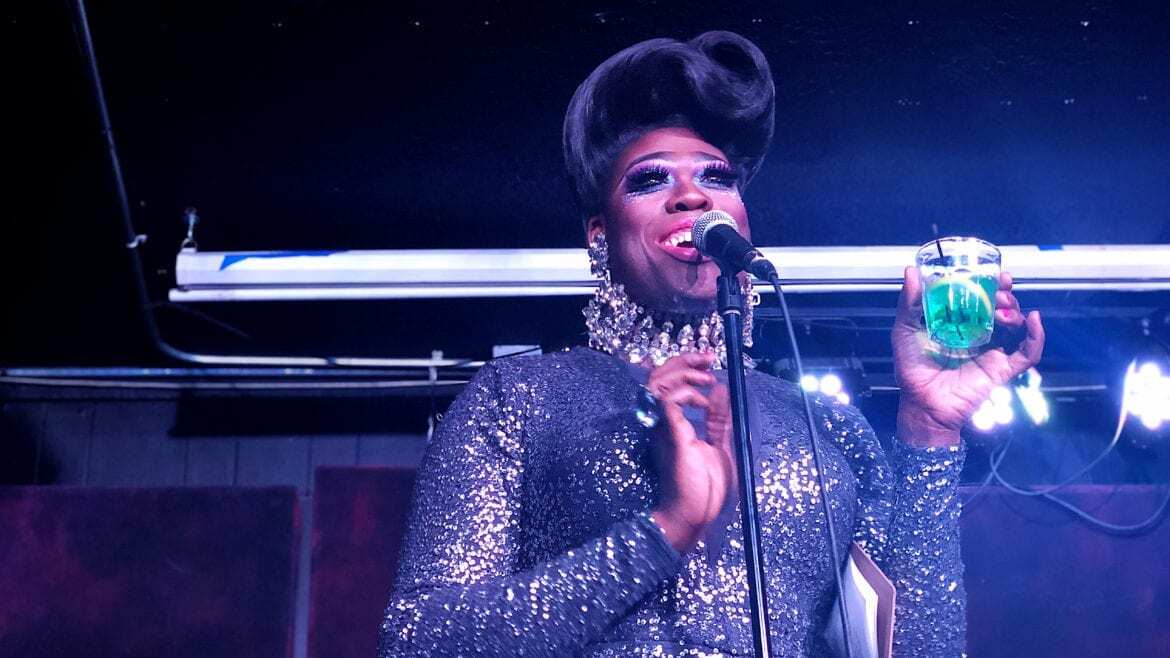
curiousKC | Your Questions on KC’s LGBTQ+ Community — Past and Present — Are Welcome
This month, Flatland focuses on Pride in Kansas City. What questions do you have about inclusive spaces for the LGBTQIA community in and around KC? Write in.
curiousKC | Answers to COVID Questions You Need to Know
Bookmark Flatland’s curiousKC FAQ, where we answer your questions about COVID-19.
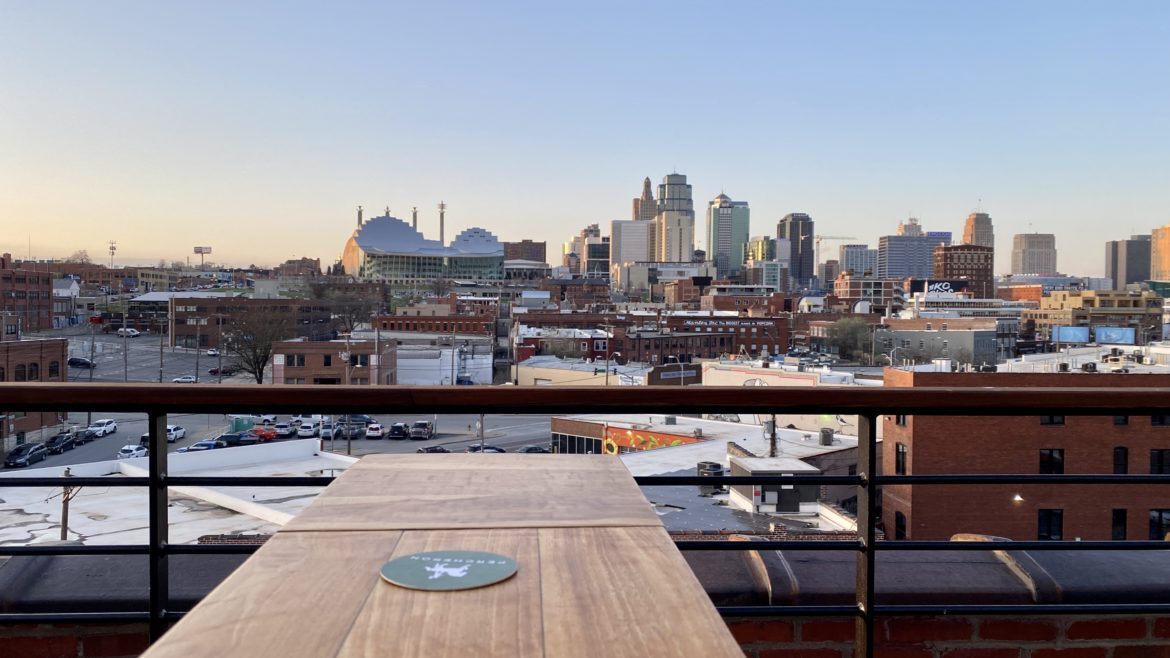
curiousKC | A Guide to Rooftop Patios in Kansas City
Here’s a guide to Kansas City’s best rooftop decks and patios.

curiousKC | ‘Up, Up and Away’
The curiousKC team covers the history of Kansas City Charles B. Wheeler Downtown Airport, and its role in the city’s development.
curiousKC | Remembering the Sacred Heart and Our Lady of Guadalupe Consolidation
The curiousKC team recounts the closure of Our Lady of Guadalupe parish, located in the Westside neighborhood of Kansas City, and its consolidation with nearby Sacred Heart.
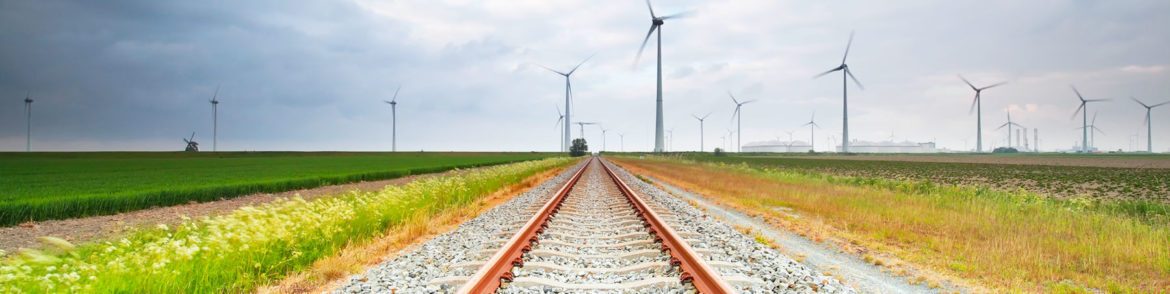
curiousKC | Any Questions About a Big Renewable Energy Project Coming to the Midwest?
This month, the Flatland Show and curiousKC focus on renewable energy and how new plans will affect the region.
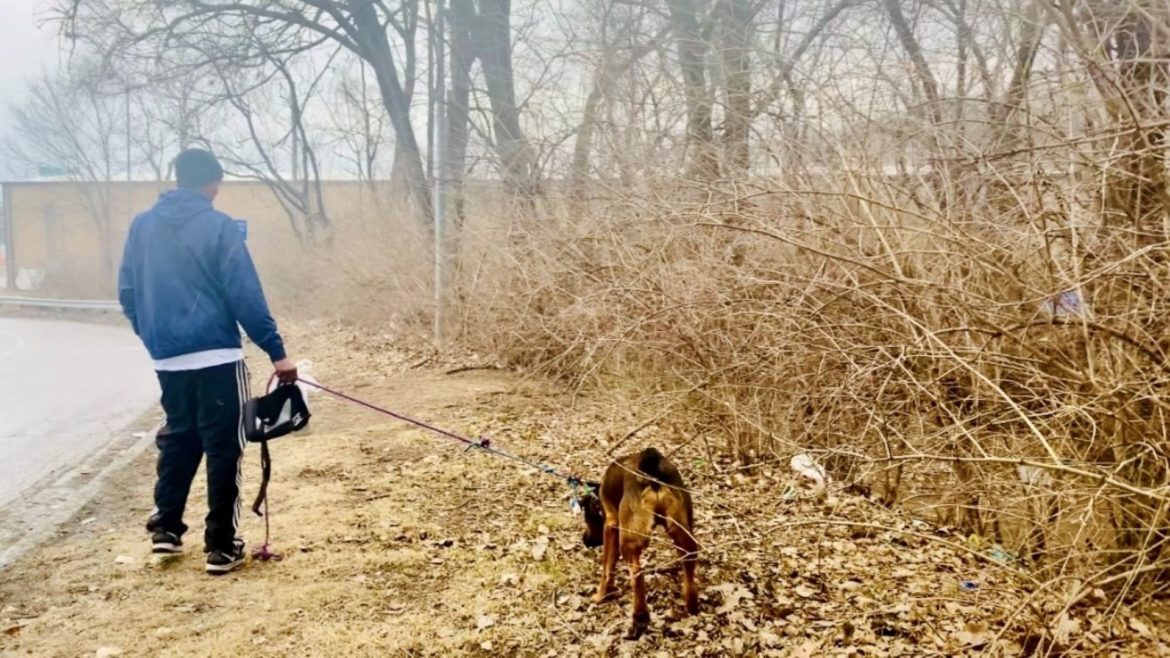
curiousKC | What Help Is There for Unhoused Pet Owners?
In Kansas City, more and more folks find themselves unhoused with pets. Many in the charitable sector are seeing the need for more pet friendly options.

curiousKC | How Do We Navigate Politics and Health?
Here’s a round-up of stories that give a birds-eye look at what community leaders are doing to educate, empower and keep people healthy.

curiousKC | Submit A Community Letter to KC’s Health Care Workers
What do you want to share about a health care worker in your life?

curiousKC | What Stories Do You Want to See About Health Care?
Next up, Flatland’s team focuses on the questions you want to know about health care. See our previous coverage and write to us here.
curiousKC | Who is Combating Climate Change in Kansas City?
Many organizations across Kansas City deal with climate change, but here are some of the big players and what they do.
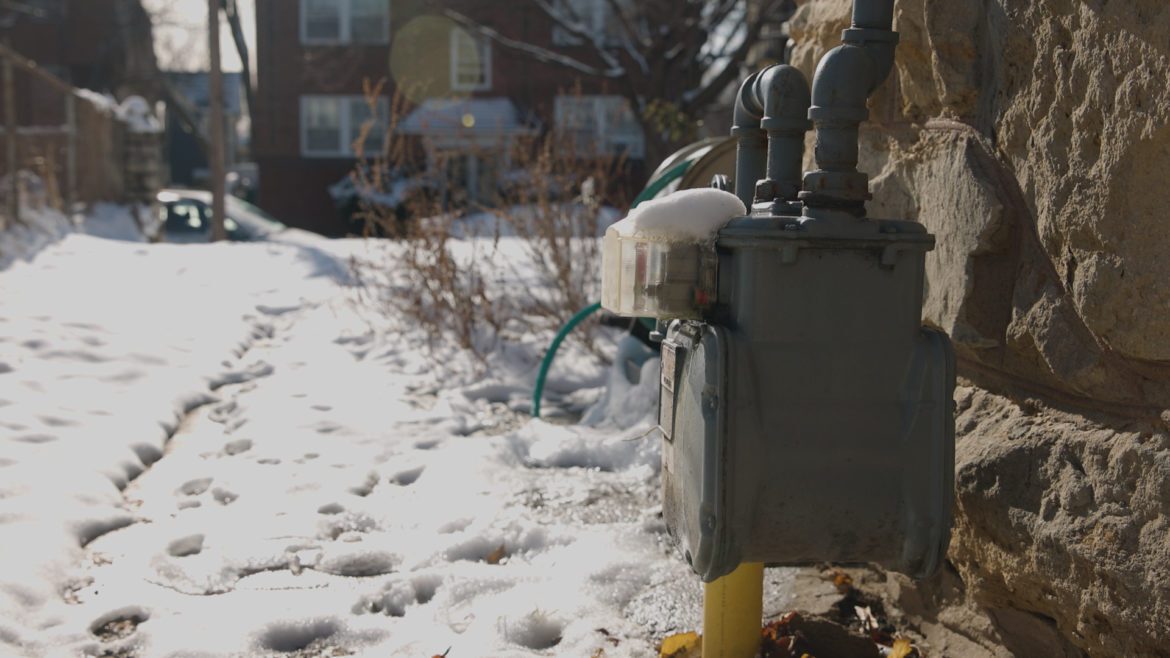
curiousKC Resource Guide | 10 Places to Go For Help With Utility Bills and Weatherization
Flatland has compiled a list of resources for people seeking help with utility bills or weatherization.

curiousKC | Inform Our Next Episode on Police in KC
curiousKC invites you to weigh in. Submit your questions about the police’s role in our community here.
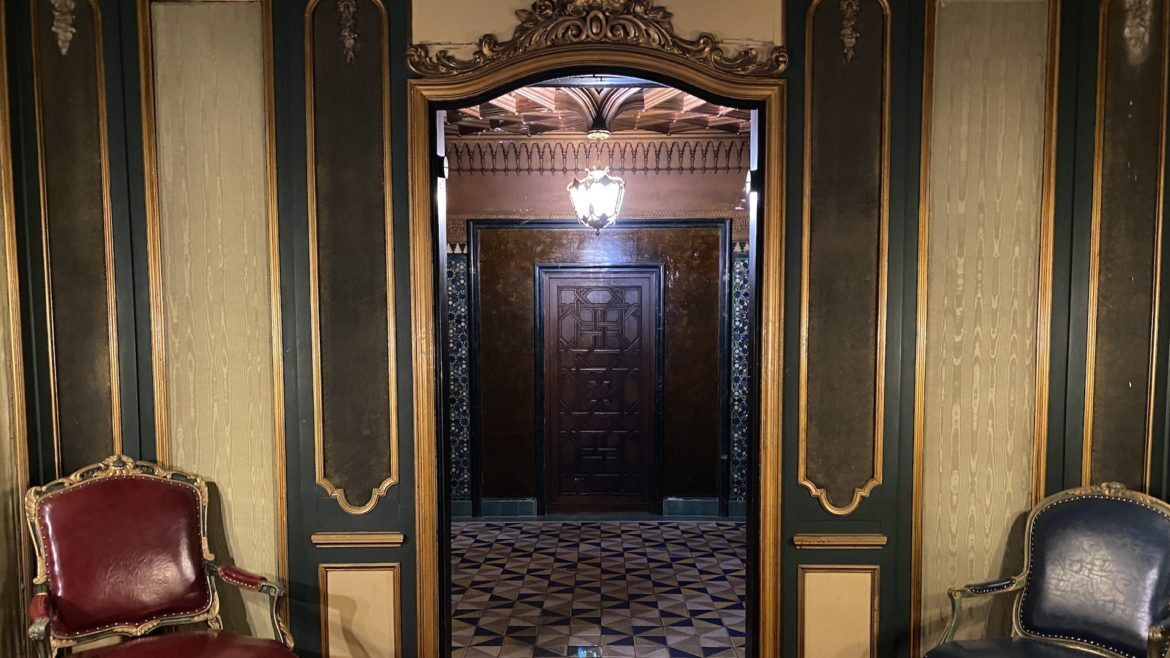
curiousKC | Vanderbilt Mansion Treasures Make Midland Theatre Space ‘Sexiest Lounge in KC’
Kansas City’s unlikely tie to the iconic New York City home has one curiousKC reader wondering how it all went down, way back in 1927.

curiousKC | Your Questions On Homelessness Are Up For A Vote
What questions about homelessness should our journalists report on next? You decide.
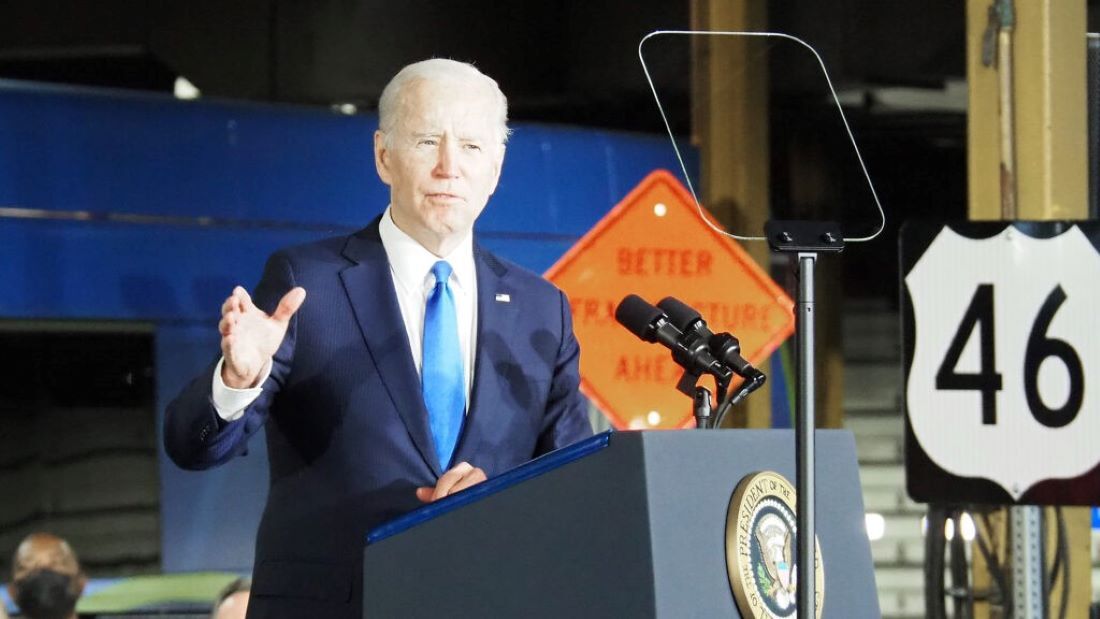
curiousKC | How Will the Bipartisan Infrastructure Law Change Kansas City?
The curiousKC team explores how federal funds from the Bipartisan Infrastructure Law may be spent in the Kansas City area.
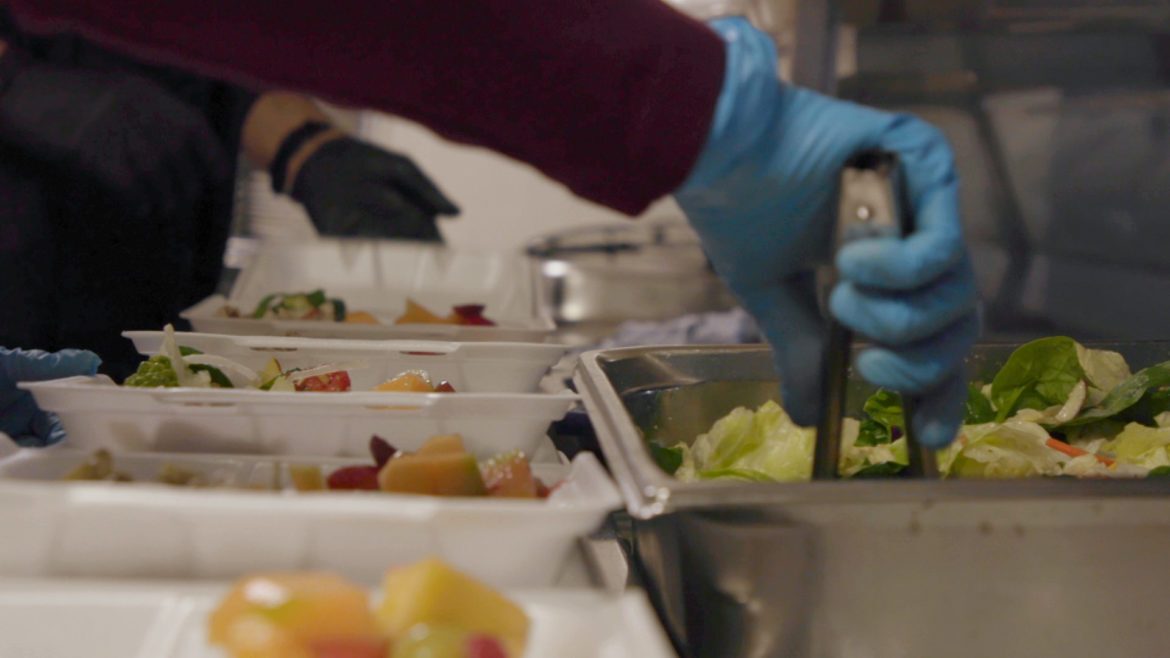
curiousKC Resource Guide | Finding Food in Kansas City and How to Get Involved
The curiousKC team has compiled a list of resources for those in need of food assistance in Kansas City, and tips on the best ways to get involved.

curiousKC | Help Inform Our Coverage of the Climate and Utility Bill Crisis
Flatland will report on the climate and utility cost issue for the next Flatland Show episode. What questions do you want our team to investigate?
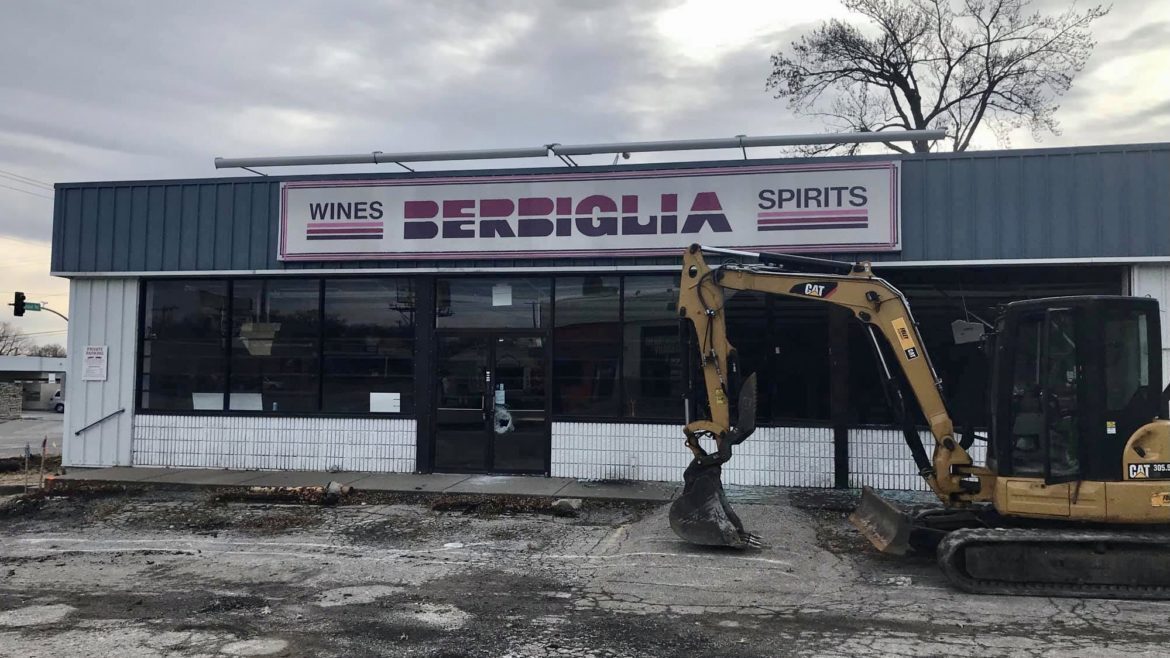
curiousKC: What Happened to Berbiglia Wine & Spirits?
With origins dating back to the early 1900s, Berbiglia Wine & Spirits once dominated the local market. But whatever happened to the chain?
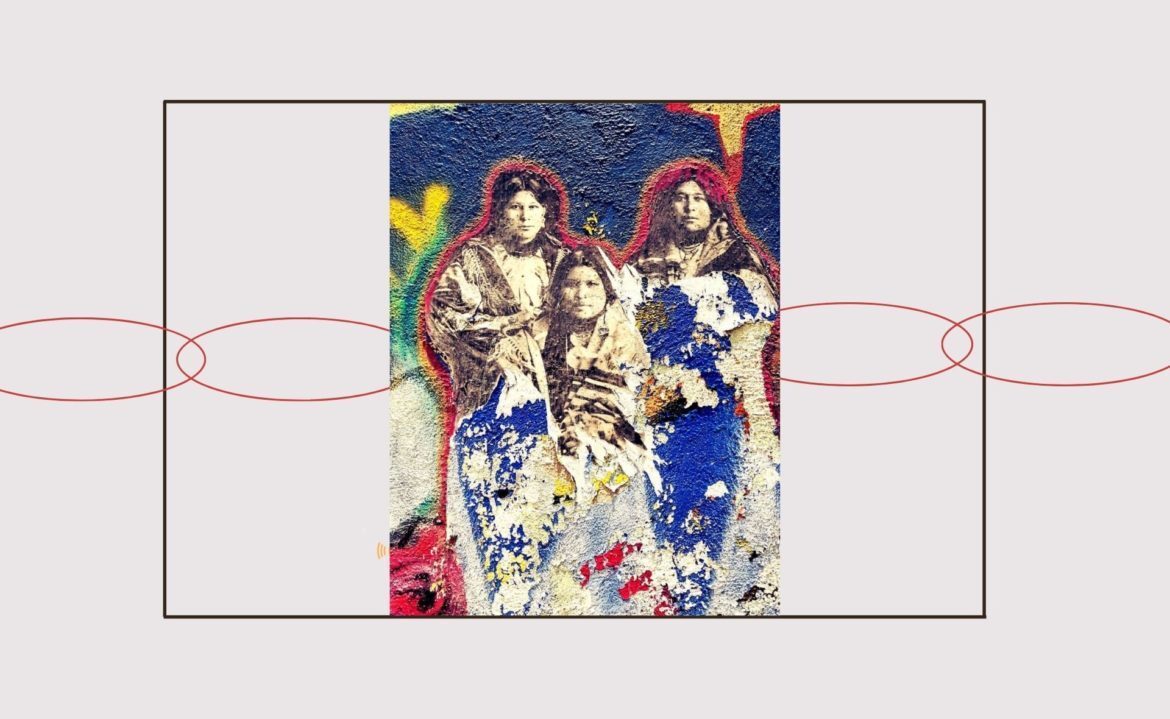
curiousKC | How the People Who Are Native to KC Lived, and Why Their Story Has Been Erased
The story of how Kansas City came to be often eliminates the story of the tribes who were forcibly removed. This is the story of the Osage Nation.

curiousKC | A Guide to Learn (and Demystify) Critical Race Theory
The legal theory “Critical Race Theory” has dominated headlines. What is it and who’s responsible? Here’s your guide.

curiousKC | The Story Behind the Sioux Scout
The curiousKC team recounts the story behind The Scout, an iconic statue of a Native American on horseback overlooking downtown from Penn Valley Park.
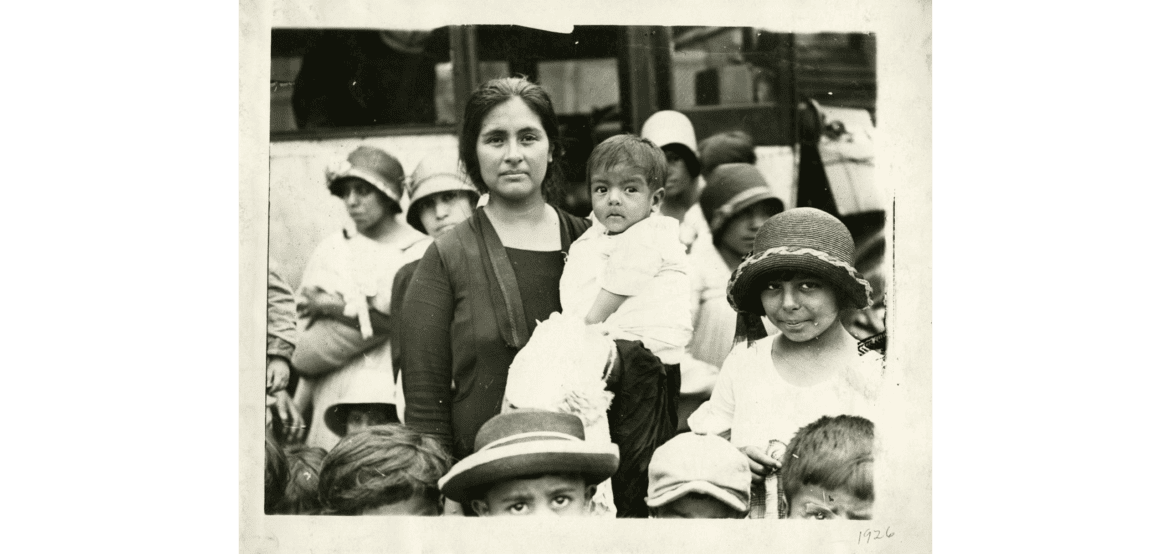
curiousKC | (Kansas City’s) Westside Story
Kansas City’s Westside community has deep roots, that have ties to the story of immigration.
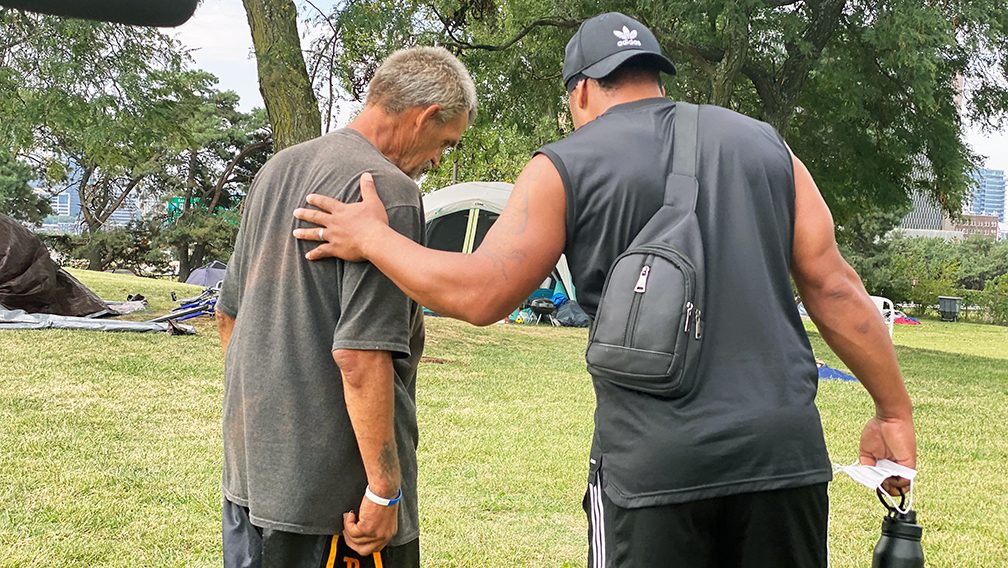
curiousKC | A Homelessness Resources Guide
Here’s a brief housing and homelessness guide with information on seeking or giving help.
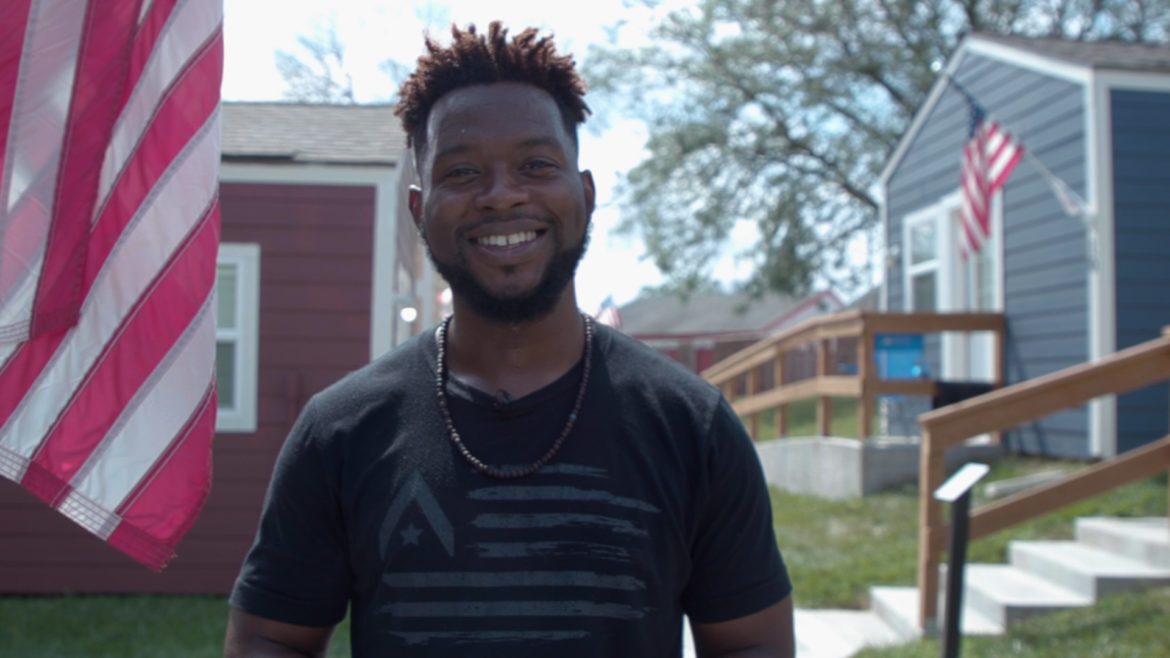
curiousKC | Tiny Homes Offer Path Out of Homelessness
The Veterans Community Project offers tiny homes and supportive services for veterans seeking a path out of homelessness.
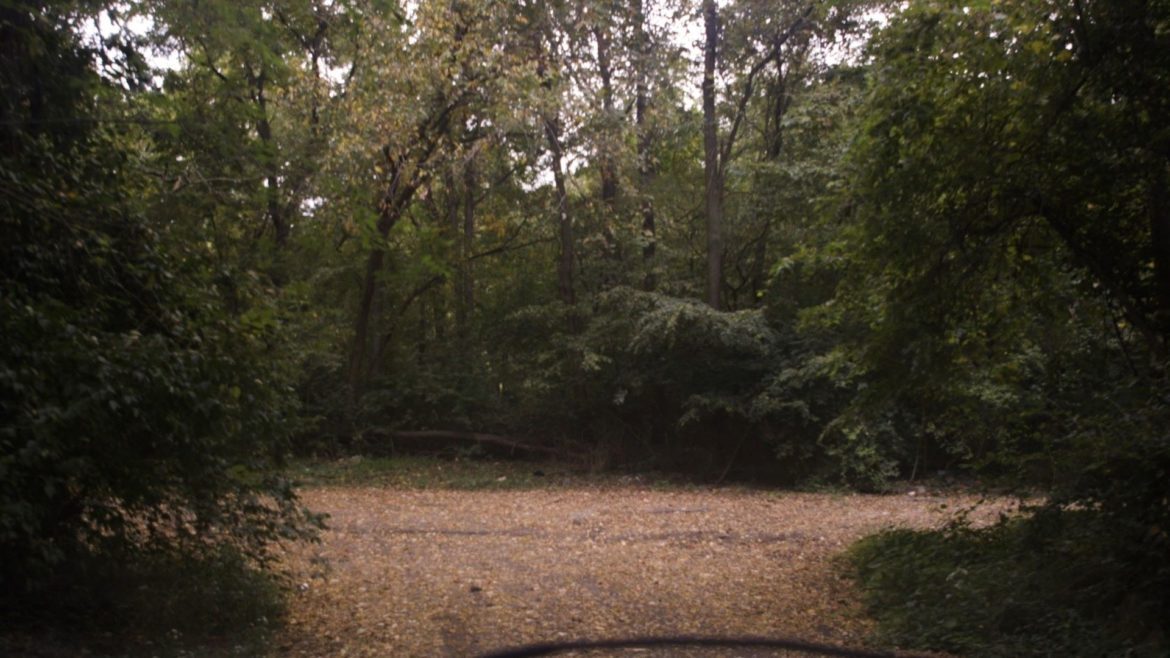
curiousKC | Resurrecting Rattlebone Hollow
The curiousKC team explores the forgotten history of a Kansas City, Kansas, neighborhood that produced a famous boxer, at least two millionaires, and a man who barely missed becoming the first Black astronaut.
curiousKC | Be Part of How We Report on Housing and Homelessness
During October, curiousKC is your platform to send all questions you have about housing and homelessness.